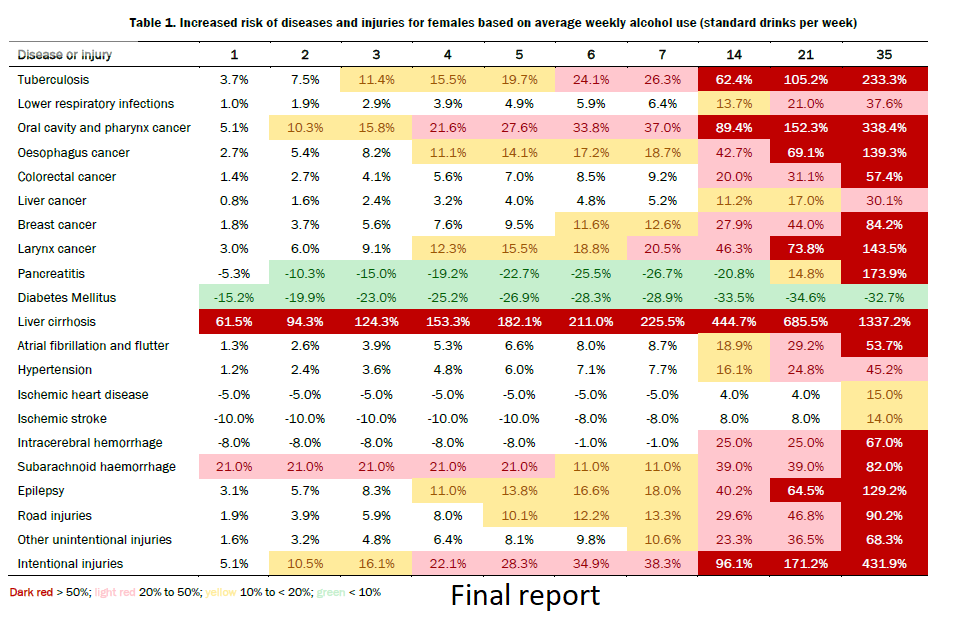
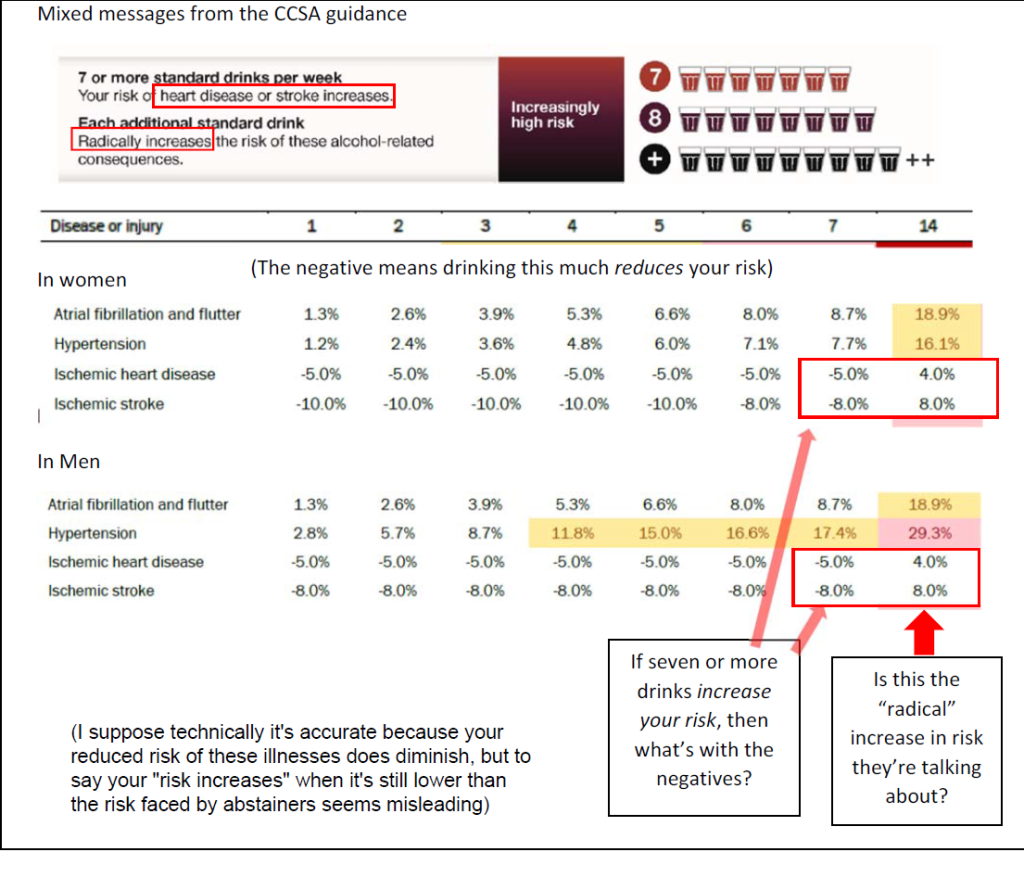
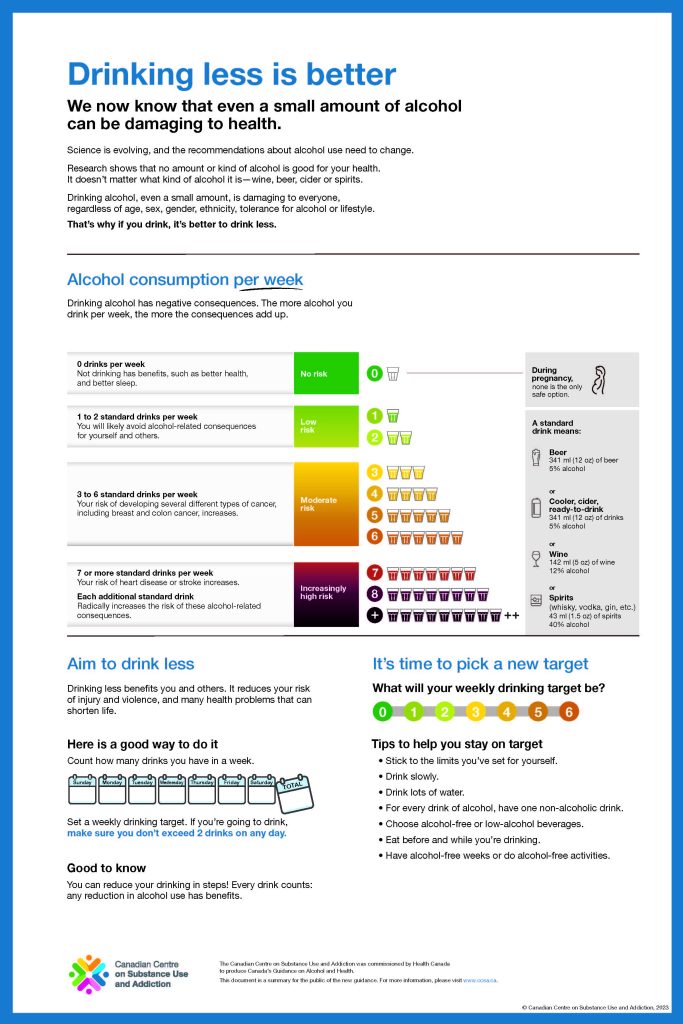
As I argued in an earlier post, the Canadian Centre on Substance Use and Addiction’s 2023 “Low Risk Drinking Guidance” used a Years of Life Lost (YLL) calculation to determine what is a low, moderate, and high risk, but YLL makes no sense for individual risk calculation.
Moreover, saying “more than two drinks per week is increasingly risky” gives no sense of how risky and what it means both to an individual and to policy makers.
When discussing this fuzzy idea of risk as a public health communication problem, some colleagues in our public health program wondered why these researchers were not using NNT: “Number Needed to Treat.”
NNT is a calculation of how many interventions need to be done for one person’s outcome to change. How many people need to be treated for X condition for one person to be healed? (For more, read this.)
If an intervention treats effectively every person who receives it, the NNT is 1:1. If an intervention is effective for 1 in every 100 people, its 1:100.
A related concept, is Number Needed to Harm (NNH). For explanation see this Wikipedia entry. For details on how to calculate it, check this site.
NNH is the number of people who need to do something for a bad outcome to happen to one person. How many people need to drive their car for one person to have an accident? (by the way NNH for car driving is much higher than for motorcycles which is why my mom would be very sad if I took up riding but some people might encourage it…)
Number Needed to Treat/Harm can be a more evocative way of understanding the necessity or power of a health intervention. If an intervention has an NNT of 1:1, the treatment should probably be recommended in clinical guidelines.
But if only one person is healed for every 10,000 people taking that drug or doing the intervention (NNT 1:10,000 ) the argument for this intervention being endorsed as a general health policy would not be as strong.
Similarly, NNH of 1:1 would mean iceberg dead ahead! (although such an NNH is highly unlikely for most things we do as a normal part of life).
Something like 1: 10,000 might mean “the only ice I’m likely to see is in my G&T.”
How does NNH inform our understanding of alcohol risk? I’ll let you be the judge.
We can calculate a type of NNH from the CCSA’s own data.
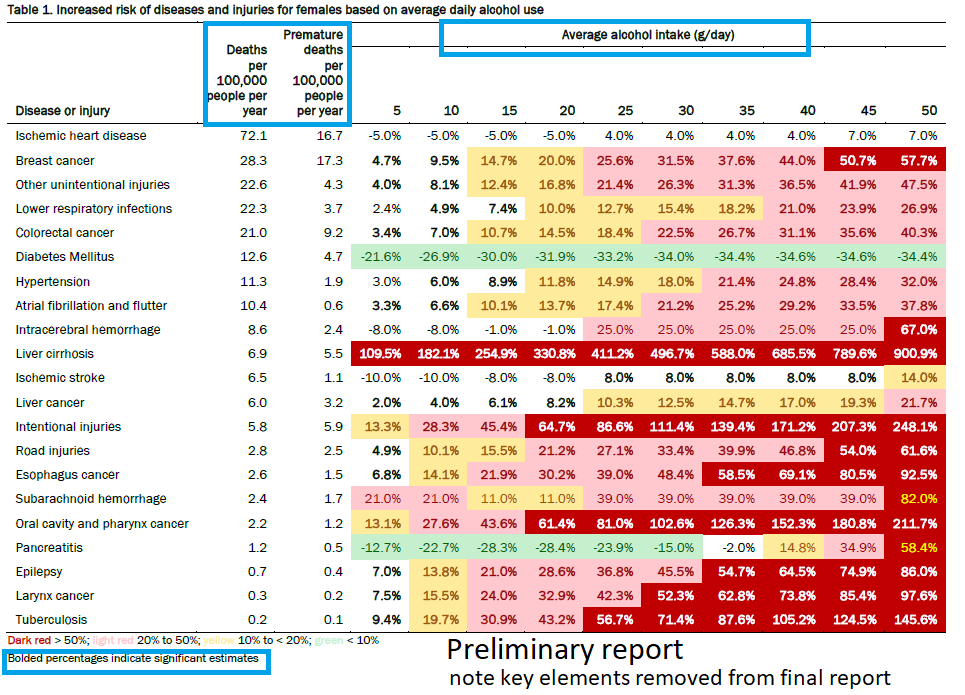
In the CCSA’s preliminary report, released in August 2022 “for public consultation” they provide a calculation of annual death rates per condition, calculating it as the rate if people did not drink. Then the relative risk data they provide is intended to give a sense of how much more or less likely it is to die from that condition, based on how much you drink per day.
Using this data for NNH is relatively easy–although for transparency I will note that I was assisted by Claude.ai. Claude did the calculations–I verified Claude’s formula on the metricgate site listed above. (And to be clear, I wrote this post myself. Claude just did some of the bulk math and yes I use EM dashes a lot in my everyday writing).
The formula is pretty straightforward: Baseline death rate (here at deaths per 100,000 per year) multiplied by the relative risk gives us the increase in number of deaths per year when drinking is added to the annual death rate.
So for example, if the deaths per 100,000 is 10, and the increased risk when drinking say 30g of alcohol per day is 5%, then the number who would be expected to die is 10.5 (5% increase of 10). That is applying relative risk as a percentage to absolute risk as a ratio (10 in 100,000).
The increase from drinking is the difference between those two numbers. So 10.5/100,000-10/100,000=0.5/100,000 or 0.000005. This is called the “Absolute Risk Increase/Decrease” or ARI.
The NNH is the inverse of the ARI, so 1 divided by ARI.
So the number needed to harm in this example is 1/0.000005 or 200,000.
So for every 200,000 people drinking 30g a day, one additional person will die from it each year.
Note: the normal way of calculating NNH is to use absolute risk (you have an X in Y chance of dying from Z condition om your lifetime). But since the CCSA provides a baseline risk in annual deaths and a relative risk as amount consumed increases, we can calculate only a per year NNH.
It is not as powerful as a lifetime risk calculation, but it does provide some pretty interesting results. And lifetime risk calculations have the same problems anyway, since risks change over the lifespan.
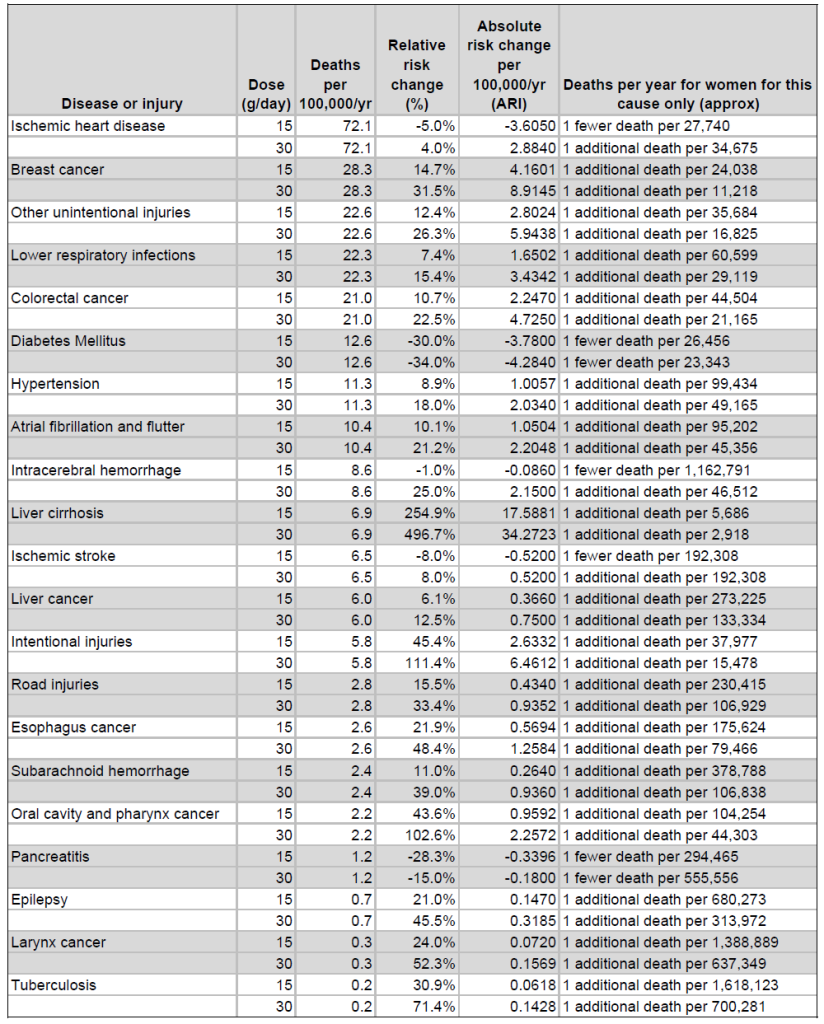
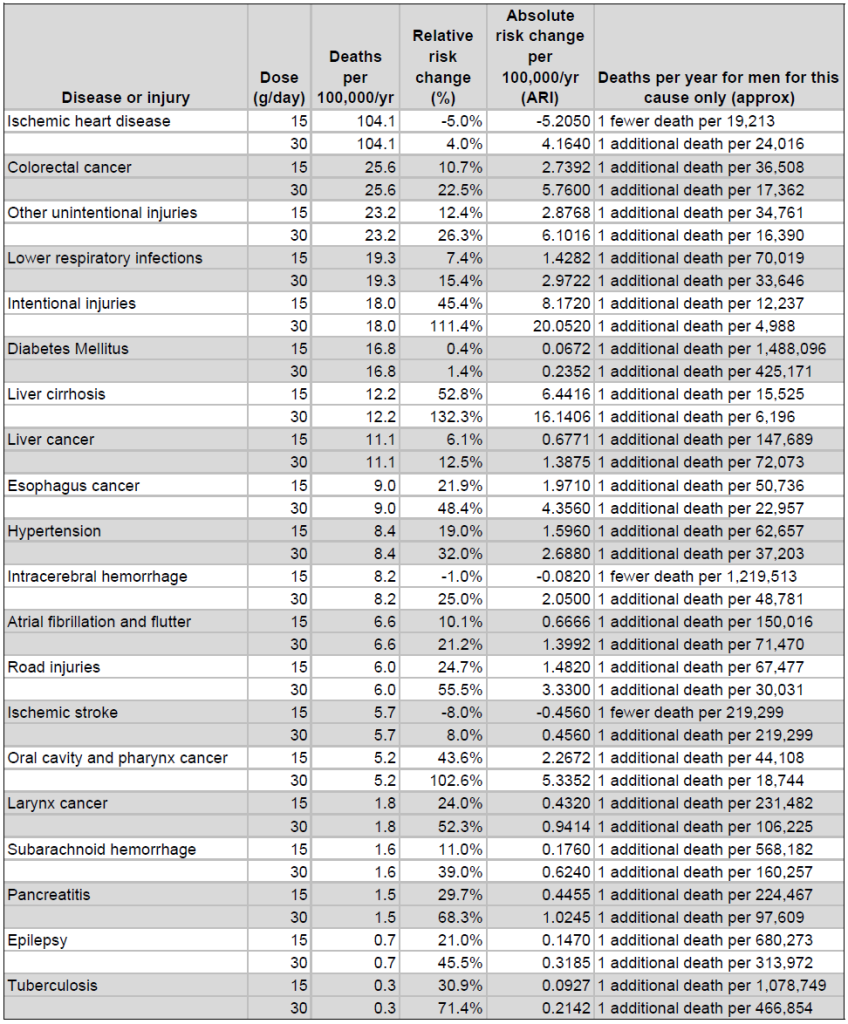
Below are the calculations for each condition listed at 15 and 30 grams/day, which is just over 1 and just over 2 standard drinks (in Canada a standard drink is 13.45g).
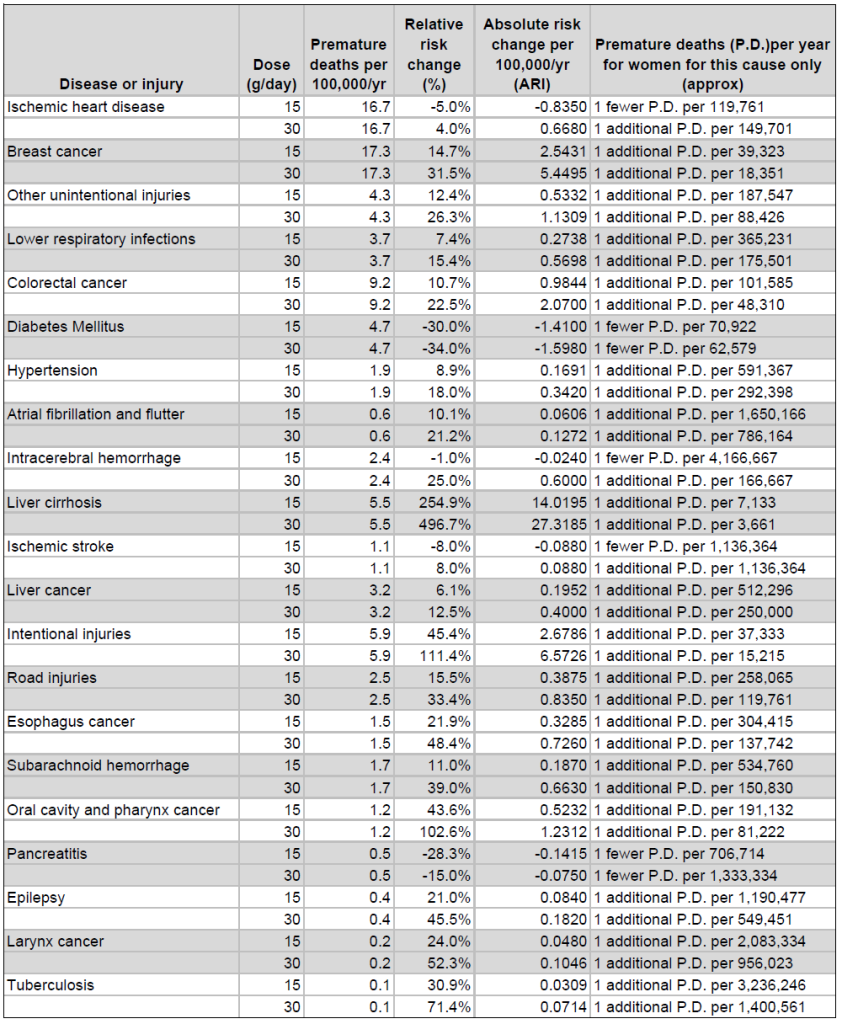
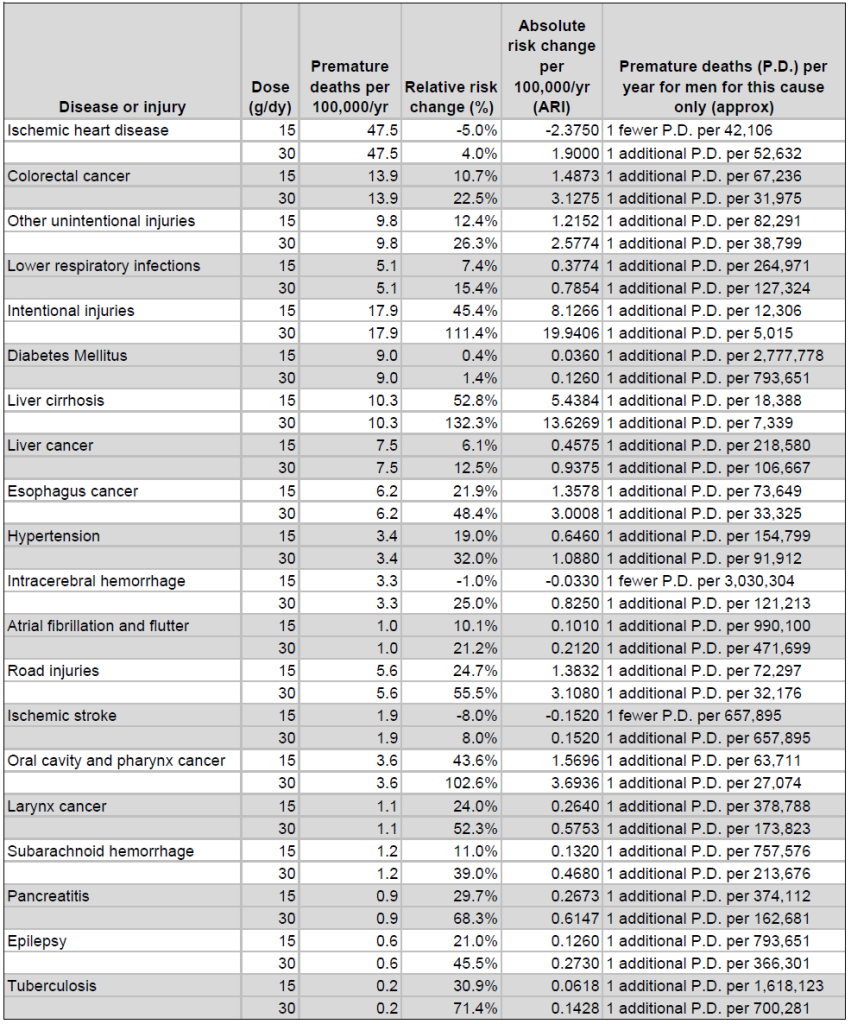
I also calculated the rates based on the premature death rate the CCSA gives for each condition. I am of two minds on this. On the one hand, since it seems people would be most worried about the risk of premature death from a condition, it would seem appropriate to use the premature death rate for NNH. My reasoning is, since we all have to die of something, the only real concern should be the risk of premature death.
However, one could also argue that the full death rate gives a better indication of the risk of dying from something.
In the end neither is really satisfying. We face different risks at different times of our lives, but, I’ve said many times, we all die of something.
The data is available at the CCSA website if you want to do the calculations for other amounts.
Beneath these tables are some of my observations.
Deaths per year for women–annual death rate
Premature deaths per year for women
Deaths per year for men
Premature deaths per year for men
How to interpret these tables:
Look at the last column. That shows you how many people need to drink that much for one additional death to occur each year.
For example, consider ischemic stroke: for every 219,299 men drinking about one drink a day, there will be 1 fewer deaths from ischemic stroke, but for every 219,299 men drinking about 2 drinks a day, there will be 1 additional death.
But look at women’s data for liver cirrhosis. At 30g/day it’s 1:2918. (Now ask how this could be the case. One additional liver cirrhosis death per 3000-ish people? I’ll come back to that)
So there are a bunch of caveats, things you need to consider when reading this data.
As I have said numerous times, population level data is not really easy to apply to individual experience. So the relative risks we are using may not apply to an individual’s own case.
On top of that, this data implies that the risk remains the same throughout a lifetime. That does not capture the wide variation of health benefits and risks we encounter in our lives. (see my post comparing the 2011 and 2023 Canadian low risk guidance, and how the 2011 Guidelines considered lives as more complex than the 2023 Guidance.)
Risks change: Young men have higher risk of car accidents; someone who smokes has a higher risk of esophageal cancer; propensity to self harm is not uniform across the population; we drink different amounts at different times of our lives and even at different times of the year.
Everyone faces different risk factors and that is entirely missing from current guidance and discourse on alcohol. See my post on “Culture Scrubbing” and the social determinants of health for more on that.
An additional caveat is a problem with saying low levels of drinking lead to harms from excess. For example, it’s really doubtful that someone will die of liver cirrhosis because they drank 2 drinks per day for their entire life. I wrote about this problem a while ago.
In fact that data for liver cirrhosis belies the entire problem with the CCSA’s calculations. If it is the case that for every 2918 women drinking 30g there will be one who develops liver cirrhosis, then we would have an epidemic of liver cirrhosis in women drinking moderate amounts of alcohol, such as slightly higher than in previous guidelines.
But the reason we don’t have women dropping dead of cirrhosis all over the place is because cirrhosis kills mostly people who have been drinking sustained high levels of alcohol (unless their liver is effed-up by things like Hepatitis C). So the 500% increase at 30g is math distorting reality.
Final thoughts
NNH is a different way of representing impact of drinking and puts risk in a different light. By using the same data the CCSA uses, but not making broad conclusions about how much is too much, I’m providing a different way to understand the risk using the same data. And this info is designed to inform, but not frighten or lead you towards one catastrophic conclusion.
I hope this is helpful. But even if not, the use of NNH shows again the weakness of the CCSA guidance as an assessment of risk. But at least NNH shows that the idea of risk can be represented in a less worrisome way.
Drink or don’t drink, it’s your choice. If it makes you happy, brings you together with friends, helps you relax, is part of a meaningful ritual in your life, have at ‘er. Of course be careful and seek help if you feel your drinking is becoming a problem.
Just don’t be frightened into behaviour change because some career anti-alcohol researchers are pushing out scary data.
===
Other caveats
Epidemiologists will read this and want to know the confidence interval for each calculation. So would I. However, since the CCSA does not provide it consistently, I cannot either. There is some indication of the power of a calculation in the preliminary data (Aug 2022) when they highlight what they call “significant estimates” but that is not something I think worth going into here.
There are other conditions related to drinking that do not end in death. Some are bad, and some are good. There are also benefits to drinking. Neither of these is captured in the data I have presented.
A better way of getting a sense of absolute risk is to give lifetime risk. This however, is really difficult to get for all these conditions. And usually the lifetime risk info we get is risk of contracting an illness, not dying from it. So there is that complication.
*This post was edited on 14 September because the original formula in my example was incorrect.