If you gird yourself to read the actual data presented by anti-alcohol–*ahem*–I mean alcohol researchers you may be wondering how in the world they can offer information about the risks of one drink per week.
Consider this table from the CCSA 2023 guidance document:
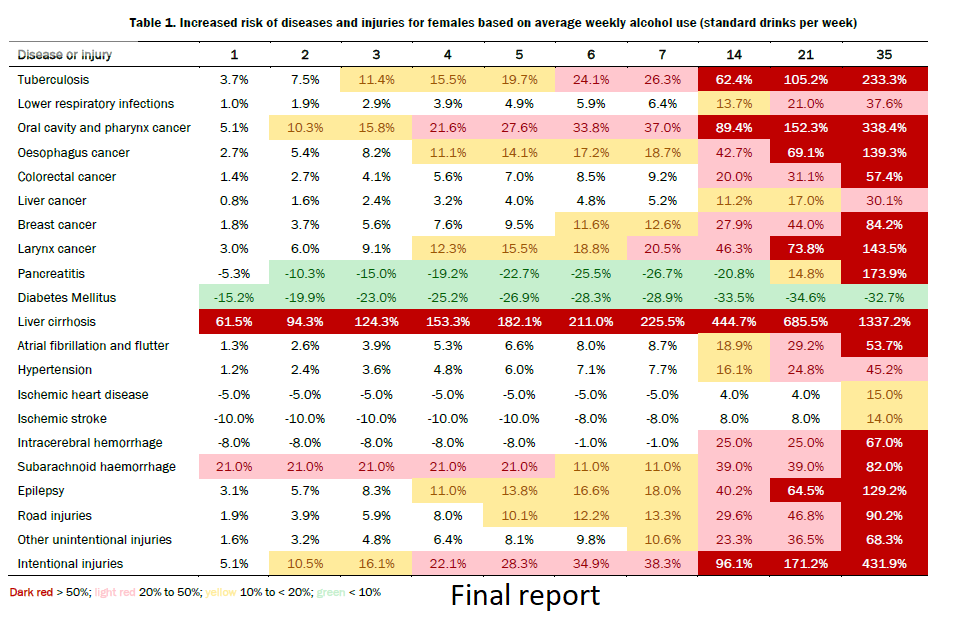
As you will notice, there is data suggesting that one drink a week increases (or decreases) your risk of different dire “consequences” (their word). If you wonder how this one drink per week information is derived, you’re not alone.
Basically, this is about mathematical interpolation. This involves making several assumptions about the risk data they have and drawing conclusions about the shape of the rest of the data based on those assumptions.
So what is going on is a series of assumptions about the effect of the “dose” of alcohol on the body.
To be clear, these are not assumptions without precedent. But they are assumptions that lead us in a certain direction, and the fact that they are assumptions is rarely ever stated.
One thing that is clear is that the data assumes some kind of consistently sloped dose-response relationship (ie: the risk increases consistently as you consume more).
“Dose response” is a concept that comes from pharmacology. Think of drug trials: If you have one Aspirin, you have a certain response, if you have two the body responds differently. If you have ten, you have a problem. (this is why we are advised not to drink while taking things like ibuprofen, since it taxes the liver and at a certain dosage it really effs up the liver).
It is useful when assessing the effect of medicines on the body. Note also that dose response is not always linear: there could be a gradual increase, or a threshold after which the effect is more pronounced. Your liver isn’t effed up by iburprofen until it is.
What is different with alcohol is that it is a natural product that the body has evolved to metabolize. A healthy liver is adept at processing alcohol in low amounts, and eventually will clear it all out.
So data indicating increased risk from low amounts is difficult to justify biologically. Simply put, if you have one drink, your body will probably be able to deal with it easily.
But that depends on what you drink and how you drink it. If you chug a beer or do shots of whisky (or even whiskey), the impact on your body is different than sipping any of these things.
To see the slope relatively easily let’s look at “atrial fibrillation and flutter” as an example. The numbers increase somewhat consistently from 1-7 drinks. 1.3% (+1.3) = 2.6% (+1.3) = 3.9% (+1.4)= 5.3% (+1.3) = 6.6% and so on I’m guessing the 1.4 is a factor from rounding. It only really takes off after seven drinks per week and that’s because the next number is 14 drinks, and 8.7 + (7 x 1.3=9.2) 17.9 a whole point below the 18.9% increase that is shown. So the slope gets slightly steeper but not really drastically so.
Other cases have other unique characteristics. I’m not sure what is going on with the data on ischemic heart disease or stroke because the protective effects remain flat for the first five drinks, then go up but of course yet again we don’t have data for the 8-13 drink range. In their preliminary report (August 2022) the CCSA authors note that the low numbers for these conditions do not meet the “significant estimates” number so maybe the just guessed or something? See further discussion below.
But we are talking about low amounts of alcohol consumption. It is really difficult to identify the actual outcomes of drinking for people who have had only one drink per week, because most people usually report less than they actually drink, and most people who drink probably have more than one drink a week. (note my guess here).
We also know that most people who drink tend to drink moderately, so there is probably more data on those people in the 5-10 drink/week range than in the 1 drink per week range.
This is probably easier to see in the preliminary data, which indicates also something they call “significant estimates” basically saying they have more confidence in the bolded data.

In this table we see consumption of grams of alcohol per day. Normally you don’t think about grams of alcohol, so if you need to convert it. Consider in Canada a standard drink contains 13.45 g, but an easier way of thinking of this is a standard drink is 0.6 oz of alcohol. That’s the equivalent of 12 oz of 5% beer (12 x 0.05=0.6), 5 oz of 12% wine (5 x 0.12=0.6) or 1.5 oz of 40% spirits (1.5x 0.40=0.6).
Here the increase is not hampered from absent data (the 8-13 drink / week gap). But it does show some weird outcomes in some cases, and which are not linear. I mean what is happening with intracerebral hemorrhage? Up to 20g/day (1.5 drinks or 10.5 drinks/week) the data shows reduced risk, then it leaps to 25% increased risk, but stays there up to 45g/day which is 3.3 drinks or a whopping 23.4 drinks per week. The data for diabetes is also interesting, rising up to about 3 drinks per day, then seeming to nearly flat-line.
All this to say there is plenty of reason to be skeptical of the conclusions just from this data table. But why?
To be perhaps overly simplifying it, constructing this type of data requires a number of specific decisions about how to proceed. For example, there are studies showing that drinking reduces the risk of certain cancers but they do not show up here; there was a decision to exclude that data probably based upon interpretation of the validity of the research. The decision to include estimates of one drink per day is, as I noted above, notwithstanding the fact that certain ways of drinking are less problematic and the data has to be interpolated.
There is a ton of what I would call culture scrubbing in this research: removing the way people drink (time, pace, volume, demographics, location) from the data.
For example, according to this data, doing seven shots on a Friday night contains the same risk as having glass of wine with dinner each night. Nobody in their right mind would see that as equivalent, but this is how the data is presented (caveat: in earlier info graphics the CCSA authors do indicate that more than 4 drinks in one session is not healthy, but that is not something indicated in their colour-coded risk tables).
So if someone asks you if that one drink a week will cause cancer, don’t laugh, but maybe try to explain that any such data is taken out of real world context. If you are drinking reasonably and moderately (like at a wine tasting where you’re sipping a few oz of wine at a go) you’ll be fine. It is probably riskier to drive (sober) to the winery before the wine tasting than it is to drink those samples.
I’m not a physician, but even physicians rely upon other researchers to inform their clinical advice. Guess which researchers have their ear?
Leave a Reply